![]()
Background
This paper has been written in response to questions how the COVID-19 pandemic will affect the oil and gas globally, both in the short-term (2020/2021), as well as any systemic impact that will have long lasting implications for oil, natural gas and LNG. At the time this paper was written, the world is experiencing a plateau rate of an average 80,000 new COVID-19 cases daily (Source: John Hopkins University). Countries are in different phases in the pandemic and key concern has been expressed for a potential ‘second wave’ during the fall season in the northern hemisphere later this year. Some of the major economies, US, China and in the EU are preparing to ‘open up’ gradually, but it is yet unclear what the impact will be of restarting these economies on the COVID-10 transmission rate.
Summary
- Oil markets are out of balance in absence of capable parties to balance the market unilaterally. Declining market share makes OPEC+ reduction measures both painful and ineffective. The agreement to reduce OPEC+ production with an unprecedented 10.7 million barrels per day (mbpd) is insufficient to balance the market that has seen a COVID induced demand decline of 29 mbpd in April 2020. The oil demand decline is expected to be 9.3% for the full year 2020. Investment cut backs particularly affect US oil shale declines with 3 mbpd towards year end. Oil producers face shut in of production as the world runs out of storage. If the demand destruction is prolonged (6 months or longer), a wave of bankruptcies is expected, unless support is provided such as by easing lending restrictions. Oil prices are expected to be suppressed for at least several years. COVID-19 induced financial / economic strain cause governments and companies to delay investments and other measures that facilitate energy transition to lower carbon solutions. In the long run, the financial market may no longer be willing to cope with high oil price volatility and consequent risks, diverting their finance in more sustainable low carbon energy opportunities.
- Gas market globally (in particular LNG) has grown robustly year-on-year up to 2019; Being less exposed to COVID containment measures that primarily affect mobility, global gas demand is expected to decline moderately by 4% in 2020. Two-third of this reduction is expected to come from cross-border pipeline supplies and one-third from reduced domestic production. COVID accelerated the convergence in global gas prices. In April 2020, gas prices reached global parity at an unsustainable $2/MMBtu at key gas hubs across the world. US gas flaring is expected to reduce significantly with shut-in in of low productivity oil wells. A prolonged economic downturn following the COVID pandemic could affect global gas demand in particular for industrial use.
- LNG oversupply existed pre-COVID, particularly from newly added LNG supply capacity that aimed to take advantage of a price gap between US and Asian markets. When these large LNG capacity additions came on stream in 2018 and 2019 the price opportunity had disappeared. A share of this capacity had not been secured with long-term offtake agreements and many cargoes are now seeking markets at unsustainable rock-bottom prices. With abundant volumes at low prices, LNG demand is expected to grow moderately by 4.4 mtpa (1.2%) in 2020. However, final investment decisions on new LNG projects in 2019 totaling more than 66 mtpa will further compound and extend the market imbalance. This will cause significant distress (and bankruptcies) among smaller companies with high debt and unsecured LNG volumes. Large gas and LNG players will seek protection from market price disruptions through horizontal and vertical integration. Portfolio gas players and aggregators will likely become the key ‘price makers’ in gas benchmarks that continue to grow in importance.
In essence, the long investment cycles of oil and gas opportunities do not align well with high price volatility unless investments are protected by long term contracts. Such contracts are absent in oil and quickly receding in LNG. There are no market makers in oil and gas, only market breakers. Both oil and gas industry lack capable parties to balance the market unilaterally. Strategic storage of oil and LNG could be mechanisms to manage extreme demand or supply shocks, but an economic / commercial model is currently lacking. Furthermore, such mechanisms could become the target of market actors that aim to take profit from the managed reduction of risk by continuing or exacerbating ‘bad behaviours’.
PRE-COVID
- Oil before its precipitous decline in March 2020, had been hovering in a relatively stable price range of $58-65 for Brent, due to OPEC+ market action to cut back production. Oil production increases in the US during 2017-2019 significantly outpaced volume declines from Iran, Libya and Venezuela, requiring forceful cutbacks from OPEC+ to stabilize the market. OPEC+ production cuts agreed in January 2017 were extended in December 2019 when OPEC+ increased reductions to 2.1 million barrels per day (mbpd). On March 5th 2020, OPEC+ failed to agree to additional production cuts of at least a further 1.5 mbpd, needed to extend their earlier measures expiring end March 2020. The absence of agreed quotas caused an immediate oil market collapse. Saudi Arabia, Russia and UAE threatened to significantly oversupply the market. The underlying objectives for this ‘scorched earth approach’ remain unclear. Russia wanted revenge on US oil production in retaliation for sanctions against Rosneft’s Trading for its support in selling Venezuela’s oil. OPEC+ was frustrated with US shale irresponsible oil volume increases, negating their measures. A period of low oil price could trigger a flood of bankruptcies of US shale as financial markets were closed to increasing their lending requirements.
- Gas In 2018, global natural gas demand grew by 4.6%, the largest growth rate since 2010[1]. About half of the 2018 growth was in the US with excess shale gas pushing the switch from coal-to-gas fired power generation. A further 18% of the 2018 global gas growth was driven by China. In 2019, the marketed gas production in US grew further with 10% to 39.2 Tcf, the second largest increase on record, only after 2018.
- LNG globally traded volumes increased by a robust 13% in 2019, with US LNG providing 32% of the net global LNG growth, increasing LNG volumes based on Henry Hub prices[2] ranging $4.90 - $6.10 / MMBtu in 2019. The share of short term and spot traded LNG also increased (to 34%) in 2019. Global gas prices converged to the lower end of the historic range (see Figure 1). Since 2013, the average oil indexation levels[3] declined each year, from a historic high of 14.5% in 2013 to 11% in 2019.
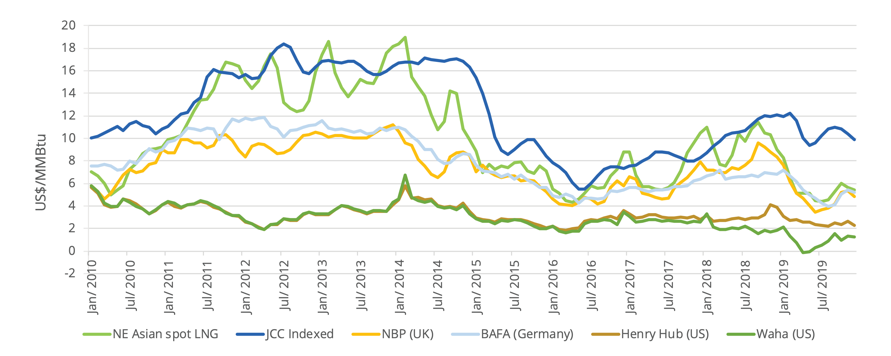
Figure 1: Global oil and gas pricing trends show a marked disconnect between JCC (Japan Crude Cocktail) prices and NE Asian spot LNG since early 2019. Source: IGU[4]
SHORT TERM IMPACT FROM COVID-19
- Oil prices slumped in March / April 2020 due to a threatening oversupply in a war for market share by Russia and Saudi[5], combined with an unprecedented decline in demand from reduced mobility due to COVID-19 containment measures (Figure 2). The broken nature of the oil market was reflected by negative WTI futures on April 20th (Figure 3). April’s oil demand is 29 mbpd lower than a year ago (-29%), down to a level last seen in 1995. Similarly, 2Q20 demand is expected to be down by 23.1 mbpd, and in December to still be down 2.7 mbpd year-on-year (9.3 mbpd down for the full year 2020)[6]. Global oil supply is expected to decline by a record 12 mbpd in May (with OPEC+ reducing 10.7 mbpd as per its deal reached on April 13th 2020)[7]. However, the OPEC+ deal alone is insufficient to balance the market and further significant volume reductions are expected when producers run out of physical storage and/or financial means to maintain production. Particularly North America onshore production will be affected, in Canada[8] because oil prices are below marginal production cost and in US because of the steep oil shale decline rates that manifest when drilling and fracking activity is reduced. The cutbacks in US are severe: from March 11 to April 29, the number of drilling rigs almost halved from 835 to 432[9]. The US rig count is likely to bottom at around 250-350 land rigs. In April, fracking operations, an indicator for short-term production additions, are expected to be down by 60% from peak levels in February. In the absence of new horizontal shale oil production wells, US oil production would decline by 1 million bpd by May, 2 million bpd by July and 3 million bpd by November 2020, significantly adding to global production reduction[10]. Revised guidelines from the US Federal Reserve to ease borrowing restrictions for heavily indebted oil and gas companies[11] may provide relief, but will also prolong pre-COVID problems of excessive borrowing and insufficient cashflow generation. North American oil exploration and production companies have $86 billion in debt that will mature between 2020 and 2024, and pipeline companies have an additional $123 billion in debt coming due over the same period[12]. Countries that are net exporters of oil and gas may experience the biggest shock from COVID-19.[13] The impact will depend on i) how well governments are prepared for the crisis in terms of ability to maintain public spending (e.g. Colombia, Malaysia, Norway, Russia); ii) reduction of investment and/or shut-in of production that could lead to longer term decline in GDP; iii) whether the economy is sufficiently diversified to take advantage of fiscal stimulus – economies such as Algeria, Azerbaijan, Saudi Arabia, Timor Leste have yet to do so.
- Gas demand is expected to be less negatively affected than oil in the global COVID-19 outbreak, due to its more diversified use in industry applications, (petro)chemicals and power. In contrast, oil products are used 94% for transport. However, in the run up to COVID-19, the global gas market was already in a situation of oversupply. Global gas demand is expected to decline by 4% in 2020, with two-third of reduction coming from cross-border pipeline supplies and one-third from reduced domestic production[14]. Similar to oil, gas also lacks an effective mechanism to balance the market[15]. Major pipeline suppliers are unwilling to reduce their prices to current spot levels and buyers are opting to receive less pipeline gas as allowed by their contracts and instead favor low priced LNG. This scenario is certainly unfolding in Europe with gas demand down to 497 billion cubic meter (bcm) from 550 bcm in 2019. Despite the demand reduction, record levels of LNG import are expected in Europe, filling the available capacity. Mainland China’s gas demand for 2020 has reduced to 312 bcm from 327 bcm in 2019, by reducing pipeline imports from Central Asia and allowing the lower-priced gas from the new Power of Siberia to ramp up as planned. An additional 2.5 mtpa LNG demand is also expected. India gas market is expected to be more strongly affected from the economic impact of COVID-19 and despite LNG terminal over capacity, this is envisaged to result in a moderate LNG import decline in 2020/2021. In South East Asia (SEA), the situation is more mixed with some countries such as Thailand expected to import more LNG that is cheaper than domestic gas resources and other countries such as Singapore reducing contracted LNG to minimum contracted volumes, topped up with some spot cargoes.
- LNG spot prices declined to unsustainable low levels in 2020 (Figure 4). Based on Cheniere’s LNG formula, a low Henry Hub $2/MMBtu price and an additional $1/MMBtu transportation cost, LNG delivered from the US to East Asia needs a price of at least $5.8 /MMBtu to be commercial. However, gas prices have globally converged to $2/MMBtu, completely eroding the price arbitrage that previously existed to underpin tens of billions of USD investments in US LNG exports targeting Asia. If this situation is prolonged, it will cause financial distress among LNG producers not protected by long-term volume and pricing contracts. However, even in this period of economic duress, an increase of 4.4 mtpa (1.2%) in global LNG demand is anticipated as LNG is more competitively priced than international pipeline gas. In addition to China (+2.5 mtpa) and Europe, upside exists in LNG imports in Middle and South America, particularly Brazil and Argentina to offset draught affected hydro (Bolivian pipeline gas not competitive with spot LNG) and West Mexico due to activity delay to connect the region with pipeline supply from US shale.
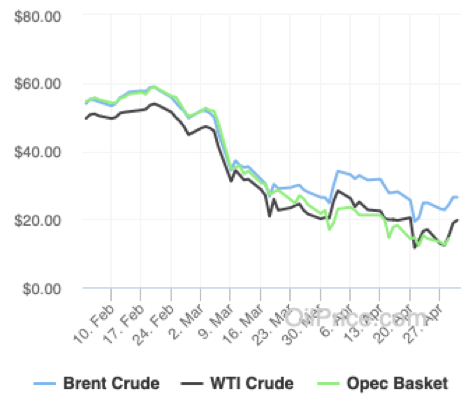
Figure 2: Global oil prices during February – April 2020. Source: Source: oilprice.com.
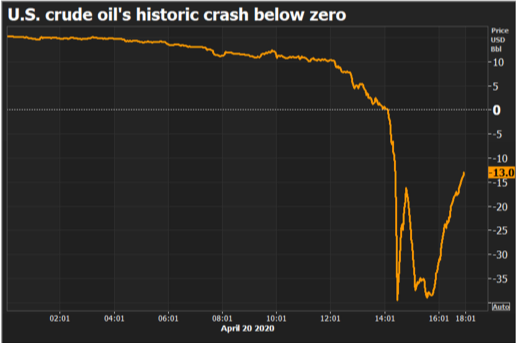
Figure 3: Negative oil prices for WTI futures on April 20th, 2020. Source: Reuters[16].

Figure 4: In April 2020, gas prices reached global parity at $2/MMBtu at key gas hubs across the world. Source: oilprice.com.
LONG TERM IMPACT FROM COVID-19
The longer-term economic and energy impact from the COVID-19 pandemic are strongly dependent on its duration and the severity of measures taken. One thing is clear, the energy markets are insufficiently robust against major supply and demand disruptions. COVID-19 caused demand destruction for oil and gas markets that were both already out of balance due to oversupply. Furthermore, COVID-19 came on top of Saudi Arabia’s and Russia’s newly instigated price war for market share and they had to quickly retreat from these endeavors to avoid a fatal blow to the global oil market that would have caused long-term structural damage. In gas, there already was an oversupply, particularly from newly added LNG supply capacity that aimed to take advantage of a price gap between US and Asian markets. By the time these large LNG capacity additions came on stream in 2018 and 2019, the price opportunity had disappeared. A significant share of this capacity had not been secured with long-term offtake agreements and many cargoes are now seeking markets at rock-bottom prices that are unsustainable. The long investment cycles of oil and gas opportunities do not align well with high price volatility unless investments are protected by long term contracts. Such contracts are absent in oil and quickly receding in LNG. There are no market makers in oil and gas, only market breakers. Both oil and gas industries lack capable parties to balance the market unilaterally. Strategic storage of oil and LNG could be mechanisms to manage extreme demand or supply shocks, but an economic / commercial model is currently lacking. Furthermore, such mechanisms could become the target of market actors that aim to take profit from the managed reduction of risk by continuing or exacerbating ‘bad behaviours’. Lastly, on the demand side, the IEA[17] expects the slump in energy demand to be far greater and more lasting than the impact of the financial crisis. Questions are already being raised about whether the IMF’s latest forecasts for the global economy[18] – described as ‘grim’, are too optimistic for almost 30 countries where fuel exports represent 40% of total exports [19]. This is due to the long-term impact of the dual shock on indebted oil-rich countries, on high cost producers, lack of economic diversification, etc.
- Oil prices are expected to be suppressed for at least several years. With the financial / economic strain caused by COVID-19 governments and companies are likely to delay investments and other measures that facilitate energy transition to lower carbon solutions. Carbon taxes, environmental regulations, infrastructure solutions are put off to avoid additional costs and reduction in global competitiveness during the longer recovery period. Moreover, reduced emissions during the COVID period could be used as an excuse that much progress has been achieved in reducing emission targets. Sustained lower oil prices also increases oil competitiveness against other (low carbon) alternatives. However, in the long run, financial investors may no longer be willing to cope with persistent oil price volatility and the consequent risks and divert their finance in more sustainable low carbon energy opportunities.
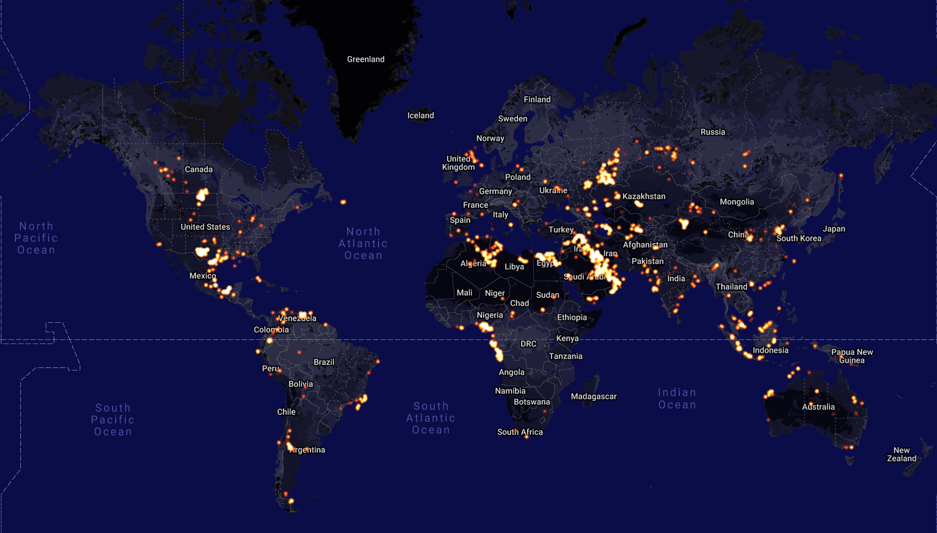
SkyTruth image of global flaring sites on 1 January 2020:

SkyTruth image of global flaring sites on 30 June 2020:
Sources: Tudor Pickering Holt & CO Weekend Digest May 1, 2020, Google Earth, SkyTruth.org
There are strong market signals that COVID-19 significantly reduced gas flaring in the US, as shut-in oil production primarily targeted remote areas with limited oil storage facilities and other (gas) infrastructure. Large oil production reductions have also been recorded in Russia, coinciding with a reduction in gas flaring, as OPEC+ production reduction agreement took effect.
- Gas market is less directly affected by COVID-19. However, a prolonged economic downturn could affect gas demand in particular for industrial use. Gas supply could be disproportionally affected from shutting in of oil wells when these run out of physical oil storage. This is particularly envisaged in US shale production. High cost, low oil productivity wells are the main targets to be shut in. 10-15% of shale oil volumes come from wells producing producing
- LNG market faces increased strain if the collapse in LNG spot prices lasts for six months or longer. Negotiations, arbitrations and litigations are foreseen to break open many long-term LNG contracts under the pressure from extremely low short-term spot prices. This does not bode well for future market stability. Some of these proceedings are already underway since 2019, compounded by 2020 declarations of force majeure on the ability to take cargos due to collapsed demand and logistical problems at ports due to COVID-19. On top of the gas demand problems, final investment decisions on new LNG projects in 2019 totaled more than 90 Bcm (66 mtpa) of capacity. Prolonged low market prices for spot LNG also are causing significant financial strain on those parties that are dependent on financial pay back of high-cost capital investments (e.g. LNG plants). Seeking protection from market price disruptions, large gas and LNG players will seek robustness through mergers, acquisitions, vertical and horizontal integration15. Portfolio gas players and aggregators will likely become the key ‘price makers’ in gas benchmarks. Gas benchmarks will continue to grow in importance. Europe is the main stage of competition between (and among) pipeline gas and LNG, while Asia is the main stage for competition between LNG suppliers.
For more information contact us at:
Email: info@energyCC.com
Website: www.energyCC.com
[1] Source: IEA Gas 2019, https://www.iea.org/reports/market-report-series-gas-2019
[2] Cheniere’s LNG pricing model is based on Henry Hub gas prices (2019 range $2.10 to $2.70, average $2.53/MMBtu) x 1.15 cost factor + tolling fee ($2.50 to $3.00) / MMBtu
[3] This is a measure of the weight of oil prices in the determination of LNG prices.
[4] International Gas Union (IGU) 2020 World LNG Report
[5] https://www.cnbc.com/2020/03/06/oil-sinks-5percent-to-multi-year-low-on-uncertain-opec-deal.html
[6] In comparison, the largest historic decline in annual oil volume demand was 2.6 mbpd during the slump in 1980. During the great recession, the total decline was 1.4 mbpd in 2009, two years after the 2007 peak (Source: BP Statistical Review of World Energy). See also: Annual global crude IEA Oil Market Report - April 2020; https://www.iea.org/reports/oil-market-report-april-2020
[7] https://www.bloomberg.com/news/articles/2020-04-12/oil-price-war-ends-with-historic-opec-deal-to-cut-production
[8] 310,00 bpd shut in of Canadian crude has been announced so far (~60% oil-sands). A western Canadian shut-in number in excess of 25% could be necessary (>1.1 mbpd) to match reduced downstream utilization.
[9] Source: S&P Global Platts analysis: https://www.spglobal.com/platts/en/market-insights/latest-news/natural-gas/043020-us-oil-gas-rig-count-falls-59-to-432-as-oil-collapse-extends
[10] Rystad Energy “US fracking set for the biggest monthly decline in history as oil prices collapse and Covid-19 persists”, 22 April 2020; https://www.rystadenergy.com/newsevents/news/press-releases/us-fracking-set-for-the-biggest-monthly-decline-in-history-as-oil-prices-collapse-and-covid-19-persists/
[11] https://thehill.com/policy/energy-environment/495549-feds-expanded-lending-program-opens-funding-to-oil-and-gas-industry
[12] https://www.nytimes.com/2020/03/20/business/energy-environment/coronavirus-oil-companies-debt.html
[13] Andrew Bauer and David Mihalyi “How Oil-Dependent countries can respond to Coronoavirus and the Oil Crash”, IMF Public Financial Management Blog, April 20, 2020
[14] Oil & Gas Journal “Global LNG demand resilient in face of COVID-19”, 30 April 2020. https://www.ogj.com/general-interest/economics-markets/article/14175076/global-lng-demand-resilient-in-face-of-covid19
[15] The Oxford Institute for Energy Studies: “A Comparative History of Oil and Gas Markets and Prices: is 2020 just an extreme cyclical event or an acceleration of the energy transition?”, April 2020.
[16] https://www.reuters.com/article/us-global-oil-crash-explainer/explainer-what-is-a-negative-crude-future-and-does-it-mean-anything-for-consumers-idUSKBN22301M
[17] See footnote 6
[18] World Economic Outlook, IMF, April 2020
[19] Andrew Bauer and David Mihalyi “IMF optimism and oil-dependent countries: be wary of sunny projections” The Africa Report, April 21, 2020


